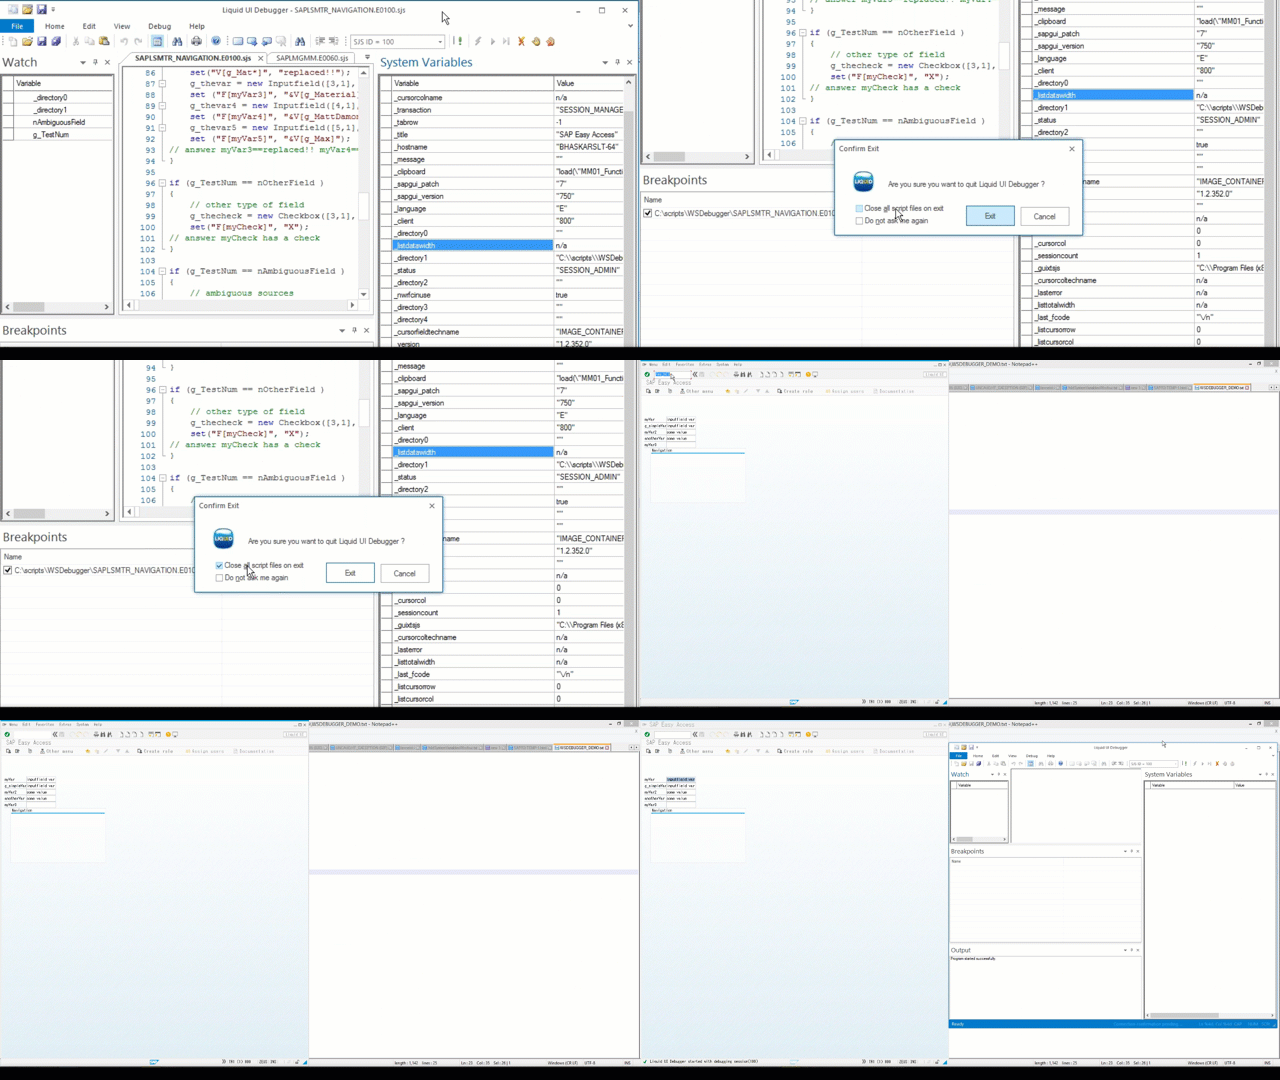
The Liquid UI Debugger is a tool designed to view the behavior of Liquid UI scripts during runtime. This debugger allows you to find and resolve the bugs to drive script execution and shows the impact instantly on SAP.
Using the following features and functionalities of the debugger, you can perform a thorough investigation of scripts:
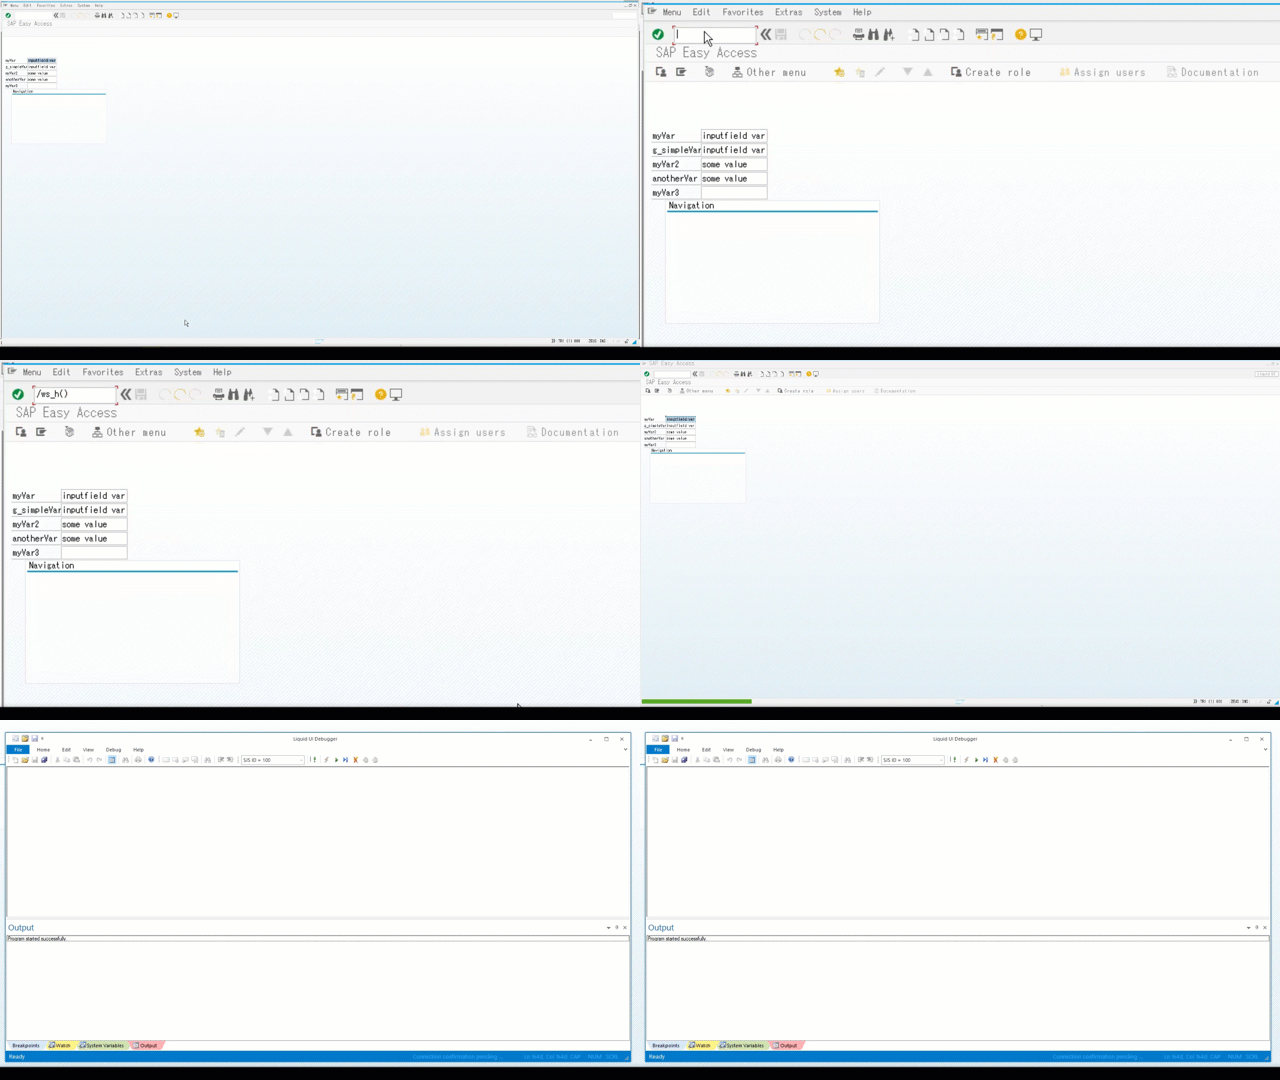
Launch Debugger directly from SAP GUI with /ws_h()
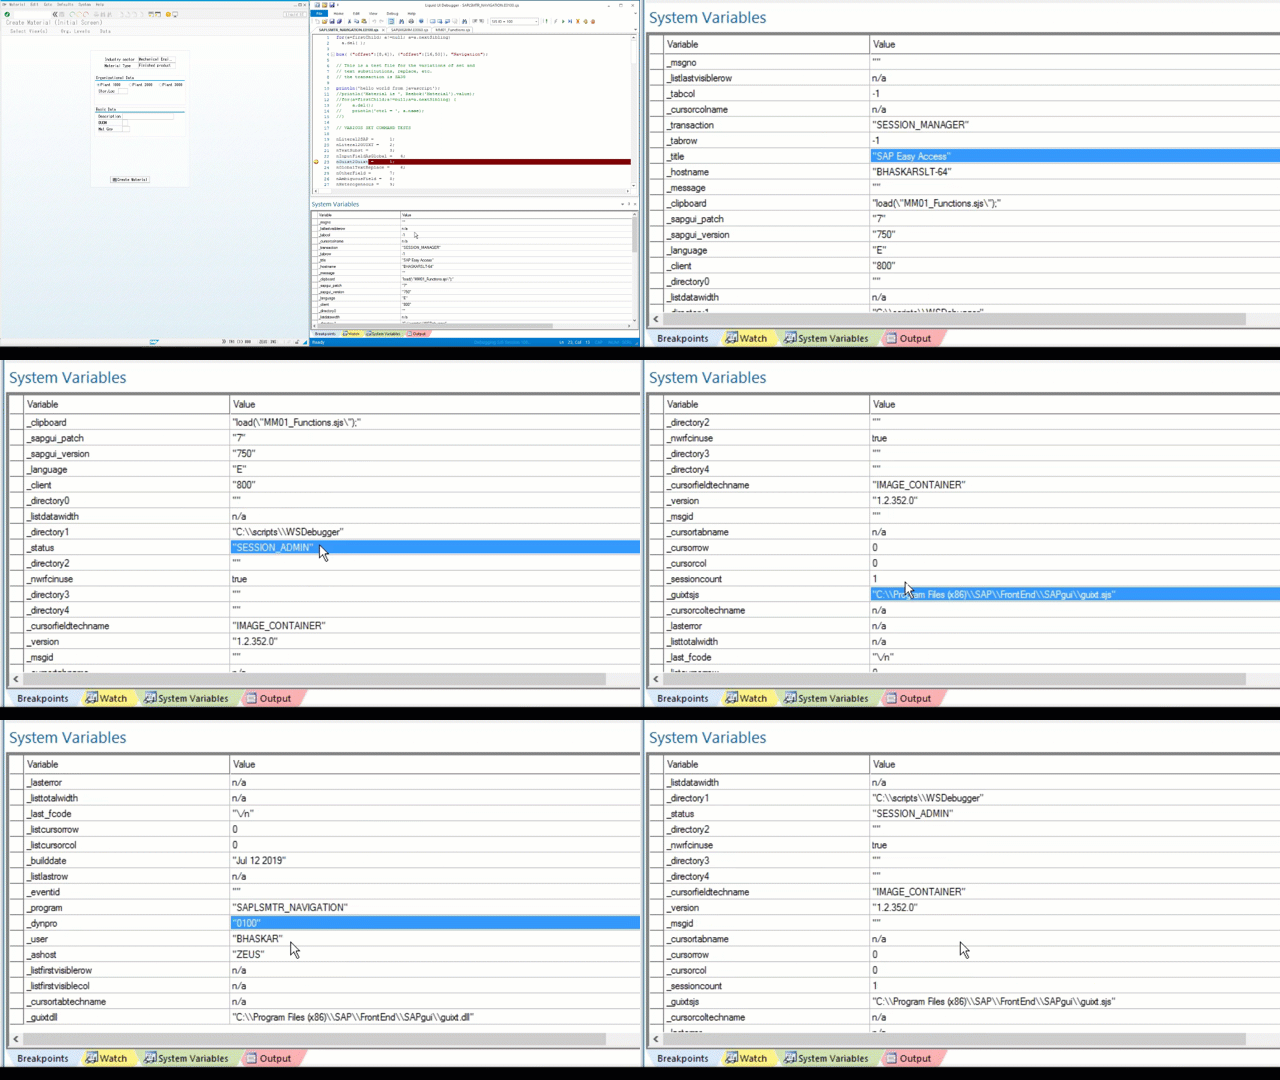
- System variables are now available in a separate window. You can have a look at all the system variables supported by WS in this window. Here you will see the system variables and other user variables used in the script with their values.
- Auto breakpoint helps you out when you don’t know what file to debug. It automatically assigns breakpoints to the script file. Moreover, Stop on breakpoint enables you to stop a running program where you suspect the bug and lets you inspect a branch of code running.
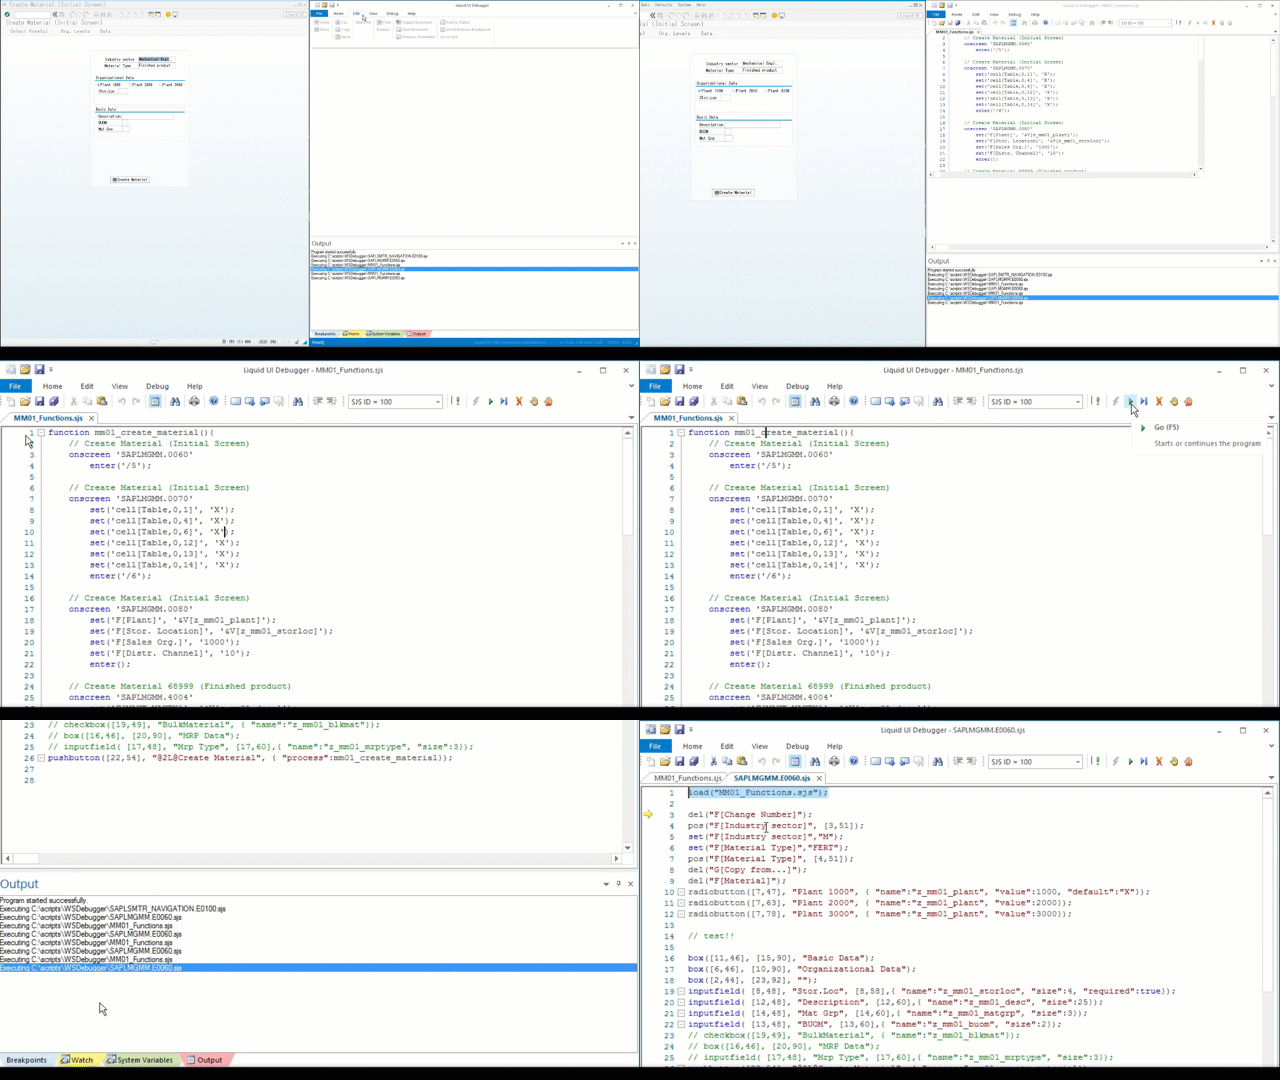
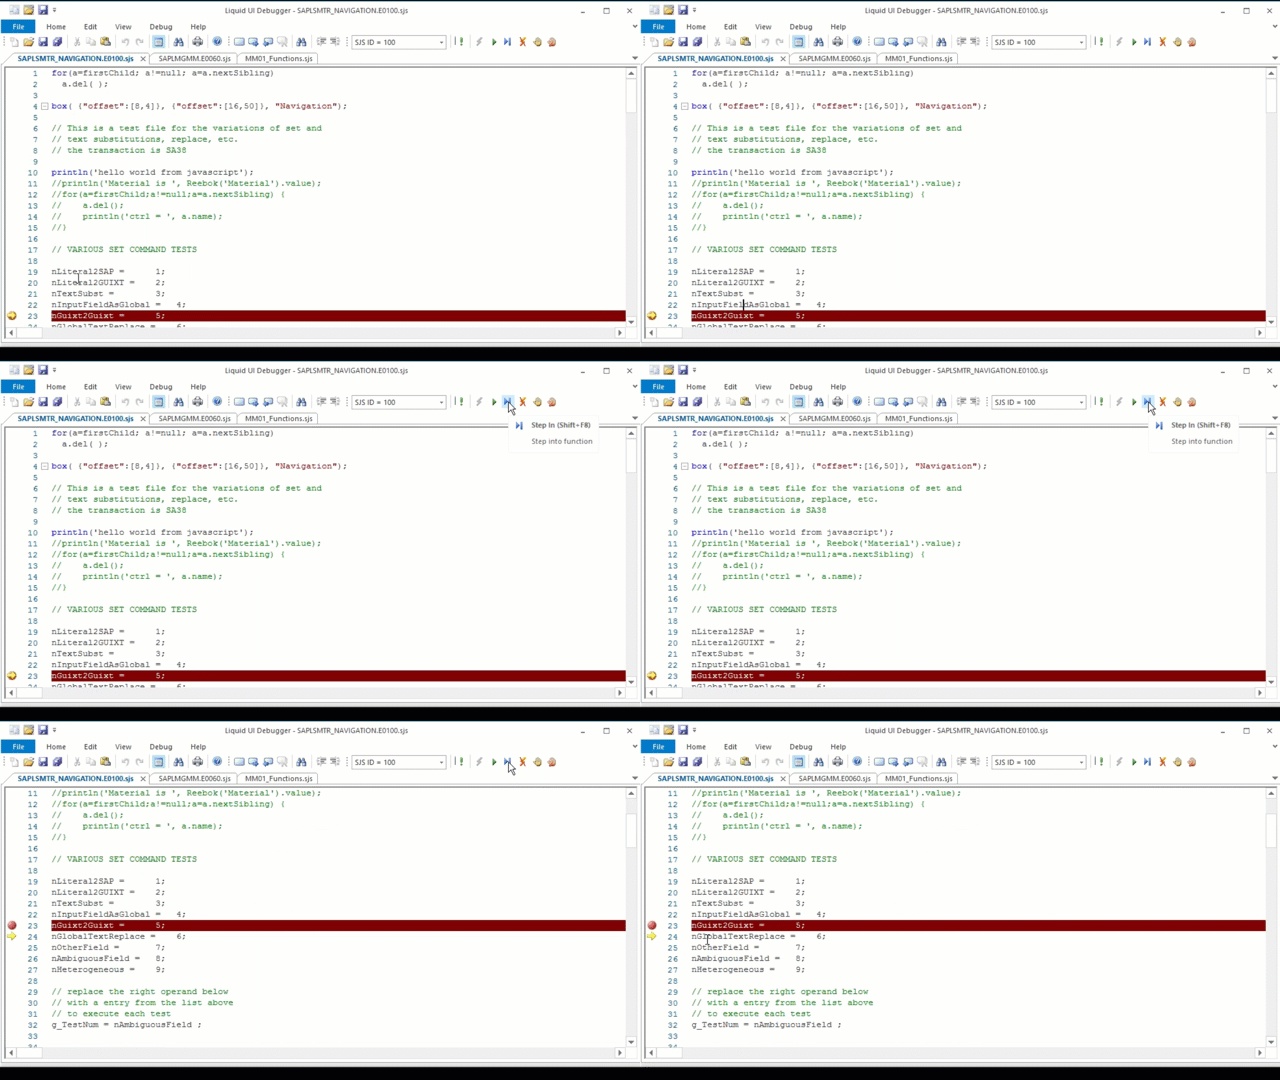
- Auto adjust cursor enabled in the debugger to show the last few lines while debugging the script using stepover functionality.
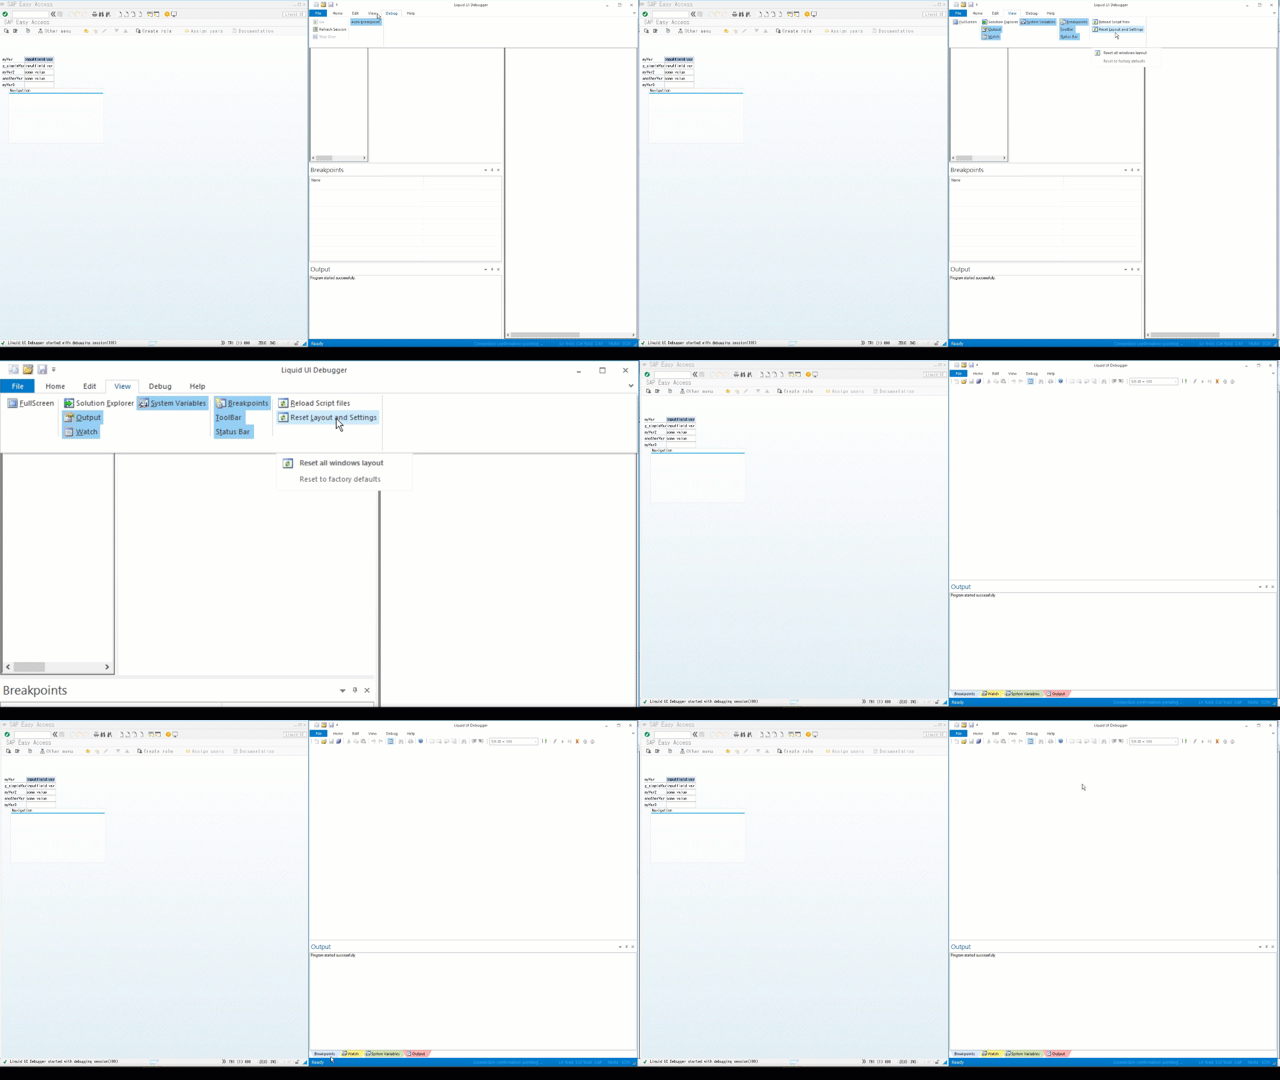
- Reset layout to factory defaults sets the debugger with default features. This feature enables users to view windows in the docking control view.
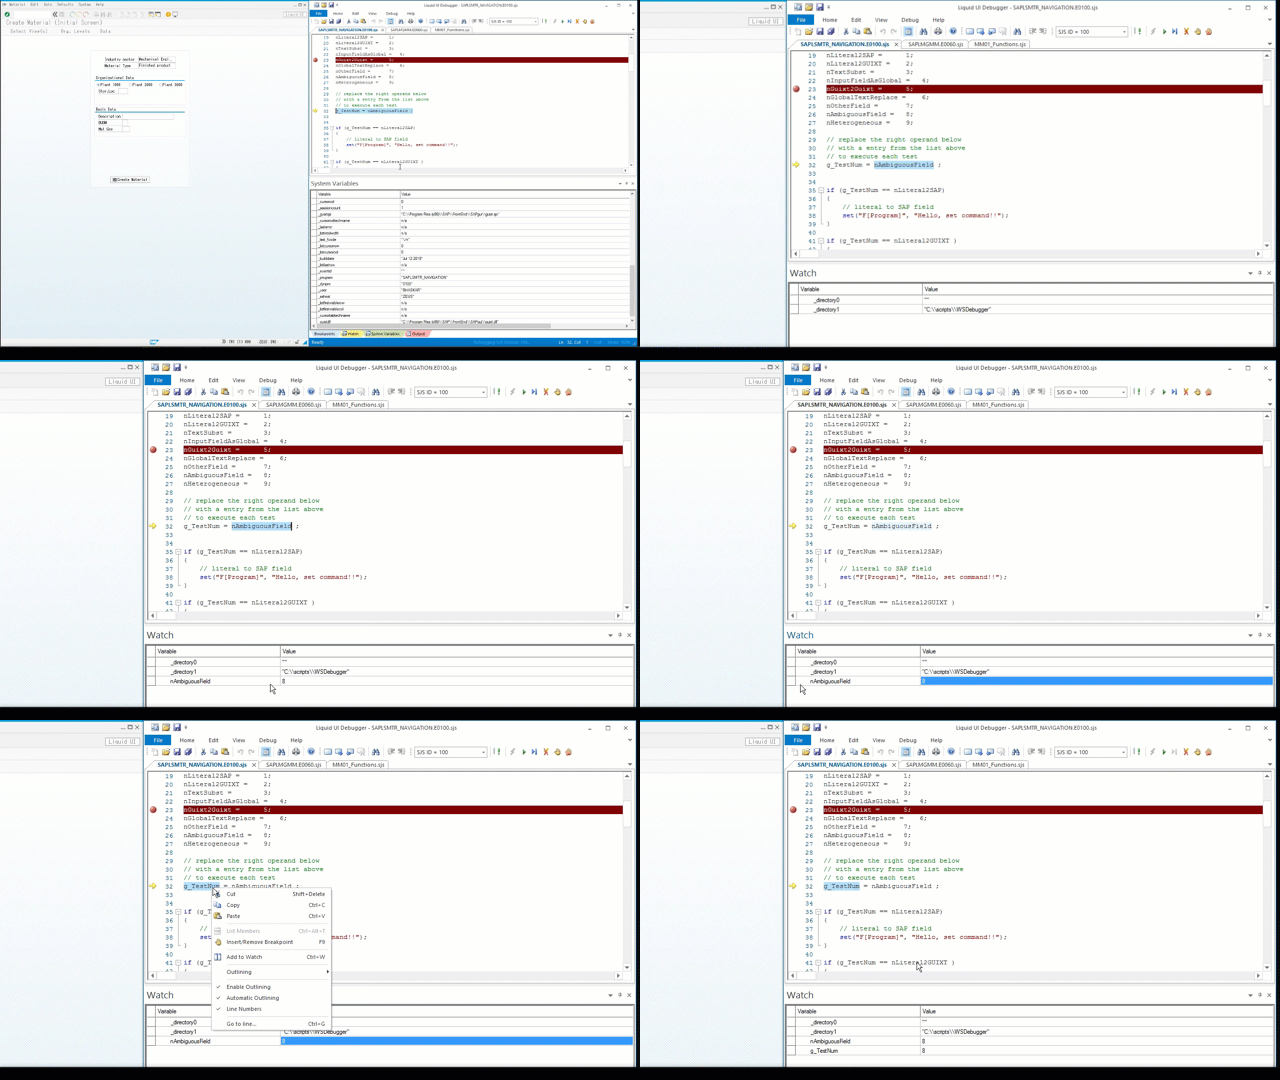
- Watch variable values - The Liquid UI debugger enables you to watch the values of the variable at different instances during the script runtime.
- Bookmarks allow you to bookmark script lines for future reference.
- Sequential debugging enables step-by-step debugging of the script to check its behavior. In this process, you can inspect each line of code in detail, looking at the values of the variables and execution flow.
- Close all script files upon exit enable you to save the changes in the script files existing in the debugger before closing it.
