Liquid UI Debugger allows WS script developers to debug scripts designed for your SAP screens. While debugging the scripts in Debugger, you can watch the value of the variable at various instances during the SAP process. In this process, you can identify the bugs and rectify them to achieve the expected behavior of the customized SAP process. Liquid UI Debugger allows you to perform debugging in two ways.
Note: You need to load scripts into WS Debugger to start debugging activity.
Step over(F8)
Step over (F8) functionality lets you debug the script sequentially line by line. The current line marker indicates the current execution line in the script and will move sequentially line by line until a breakpoint appears. You can move the current line marker to the next line using this button.
Step 1: Initially, you need to open the SAP GUI and enter the command /ws_h() in the SAP GUI command field to start the Debugger.
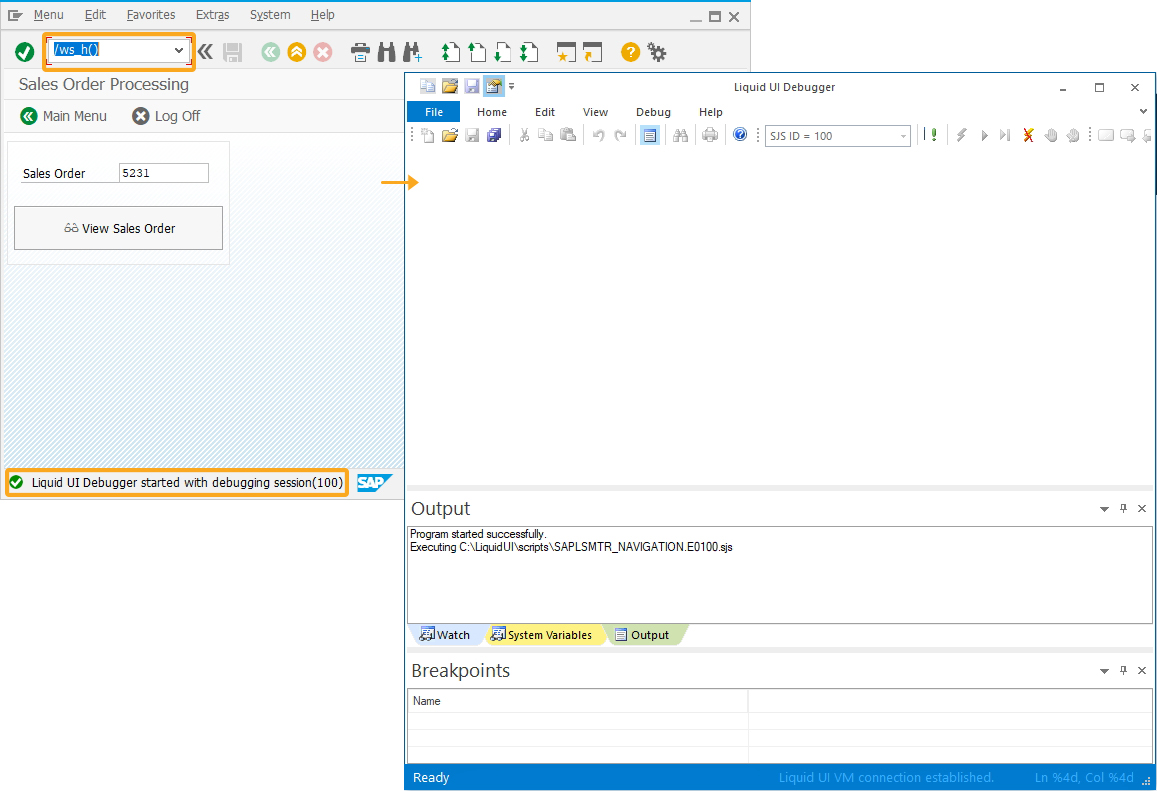
Initially the current line marker will be pointed at the execution starting point of the script file.
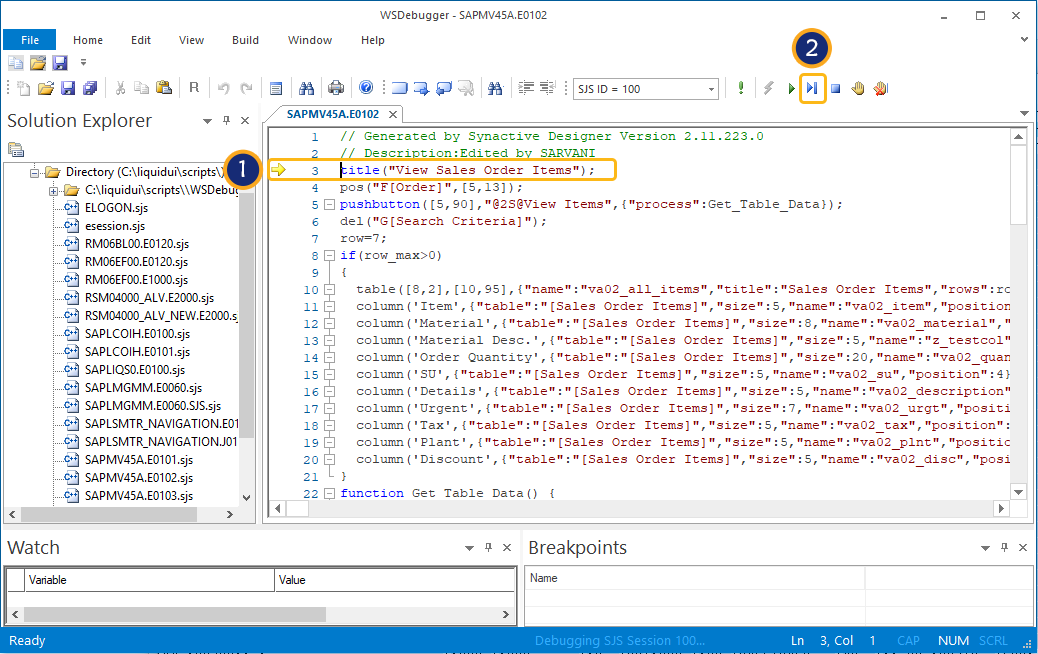
Step 2: Click the step over (F8) button in a continuous stream. You can view the current line marker in yellow is pointing to line 3 as a result of the sequential debug process.
Step 3: You can thereby reach the end of the script after clicking f8 multiple times.
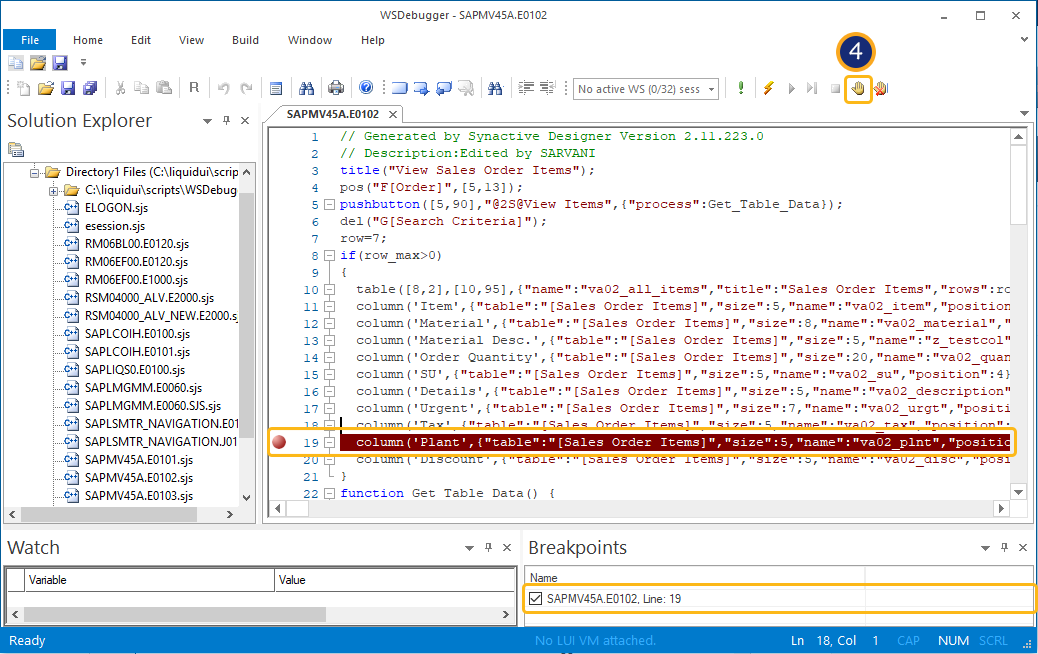
Step 4: To stop debugging from a particular line of script and to understand the behavior of the script, you can insert a breakpoint as shown below.
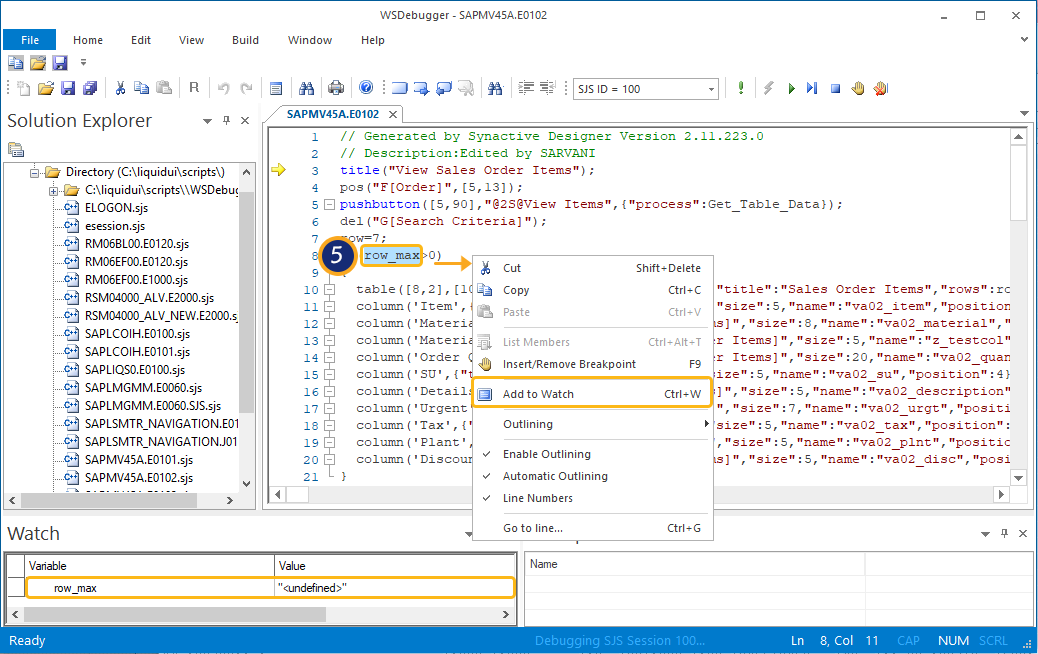
Step5: To watch the value of a variable in the script at multiple instances, You can add a variable to watch window as shown below.

Step 6: SAP GUI comes to a responsive state after the completion of the debugging process.
Note: The current line marker will not point to the lines of the script, which is been placed in comments (//…//). It skips the commented lines and places the marker on an executing statement.
Go(f5)
This button will allow you to debug the script based on the execution process. This will move the current line marker to the next execution process based on the script.
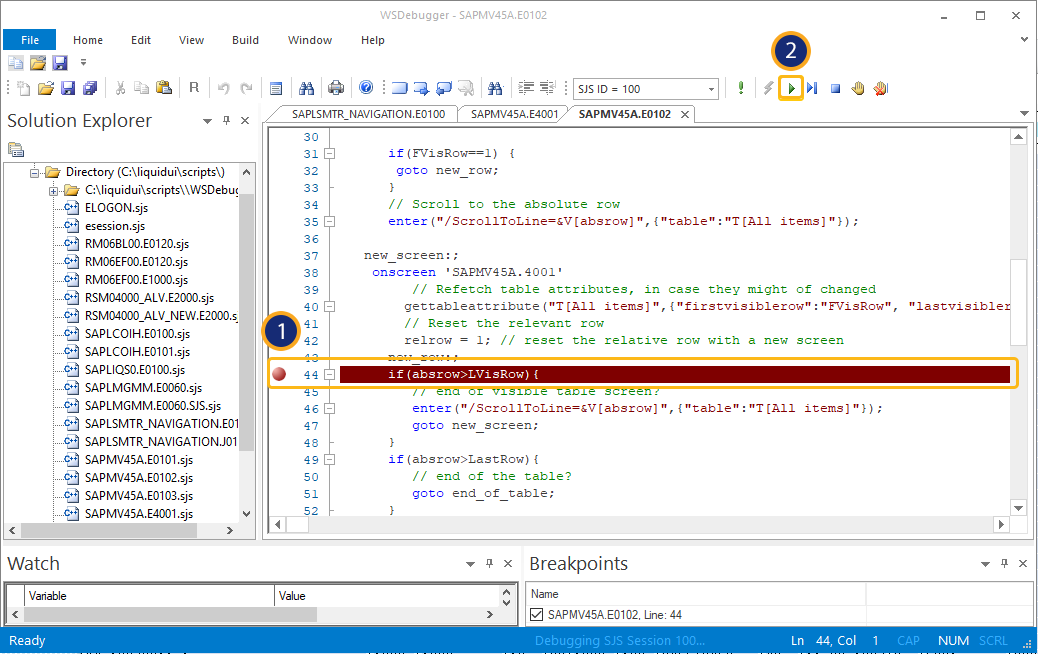
You can insert a breakpoint at any line of the script to stop the debugging process. Once the breakpoint is applied on a specified line by pressing F9, you can click Go(F5) to continue the debugging process again.
Step1: You can insert a breakpoint at any line of the script to stop the debugging process. Once the breakpoint is applied on a specified line by pressing F9, you can click Go(F5) to start the debugging process again from that breakpoint. Then the current line marker will now jump to the breakpoint and then to the next breakpoint if any.
Step2: You can view the debugging of the script stops at line number 44 due to the breakpoint. The debugger will now wait for the user activity.
Step3: If the script doesn’t have any more breakpoints, the current line marker will stops the execution of debugging activity.
Step4: To stop debugging from a particular line of script and to understand the behavior of the script, you can insert a breakpoint.
Step5: To watch the value of a variable in the script at multiple instances, You can add a variable to the watch window.
Step6: SAP GUI comes to a responsive state after completion of the debugging process as shown below: