The menu bar of the Debugger consists of the following three types of menus:

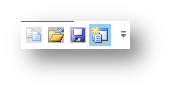
Toolbar menu
The toolbar is a set of shortcuts of text editing options, which includes copy, open, save, and toggle breakpoints.
Main menu
The main menu has the following options:
File: File menu helps you to open, save, and print the script files in the debugger. It has the following options:
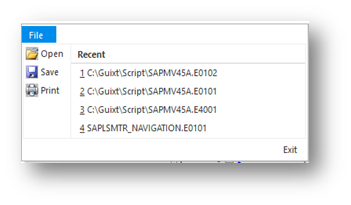
- Open – To open an existing script

- Save – To save the script that is open in WS Debugger

- Print – To print the script

- Recent – The list of scripts that you open in Debugger
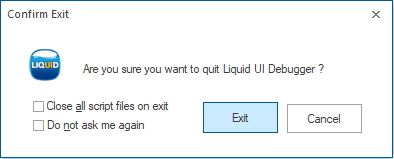
- Exit – To close the Liquid UI debugger window
Home: Home menu helps you to work on file operations. The following are its menu items:
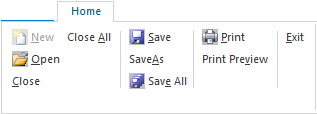
- New – To create a new script
- Open – To load a script into Debugger
- Close – To close a script
- Close all - To close all the opened scripts
- Save – To save the script
- Save As – To save the script with a different name
- Save All – To save all the open scripts
- Print – To print the script
- Print Preview – To view the script print layout
- Exit – To close the Liquid UI debugger window
Edit: The Edit menu has the following items;
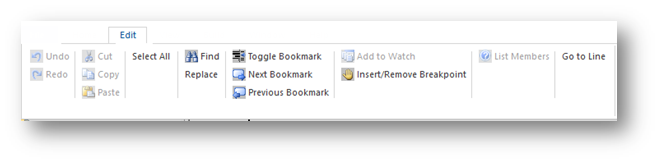
- Undo – To reverse your previous action on the script
- Redo – To recover your previous action on the script
- Cut – To delete script lines and paste to a different location (Ctrl+X)
- Copy – To copy script lines to the clipboard (Ctrl+C)
- Paste – To paste in another location in the script (Ctrl+ V)
- Select All – To select all the lines of the script (Ctrl+A)
- Find – To find a specific text in the script (Ctrl+F)
- Replace – To replace text in a script with other text
- Toggle Bookmark – To add/remove bookmark at a specific location in a script, as shown in Figure 10.
- Next Bookmark – To move the pointer to the next temporary bookmark in the list bookmarks
- Previous Bookmark – To move the pointer to the previous bookmark in the list bookmarks
- Add to Watch – To view the value that populates in a variable
- Insert/Remove Breakpoint – To stop/continue the execution of scripts
- List Members – To list related variables
- Go to Line – To navigate to a specific line in the script file
View: View allows you to enable and disable the following features on the debugger window.
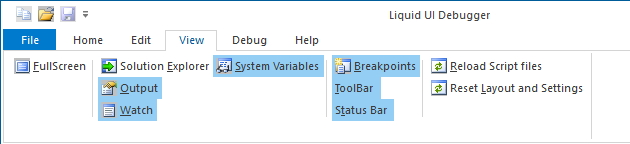
- Full Screen
- Solution Explorer
- Output
- Watch
- Breakpoints
- Toolbar
- Status Bar
- Reload Script files: To reload the script files
- Reset Layout and Settings: Resets your Debugger interface with all the default features
Debug: Debug menu allows you to debug the script to examine it in detail. You can see the following options:
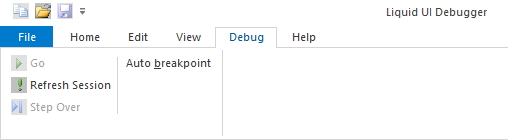
- Go: Starts debugging
- Refresh session: Refreshes the session and displays the session id
- Step Over: Starts debugging one statement at a time
- Auto breakpoint: Enable it to attach your screen script to Debugger and starts debugging automatically
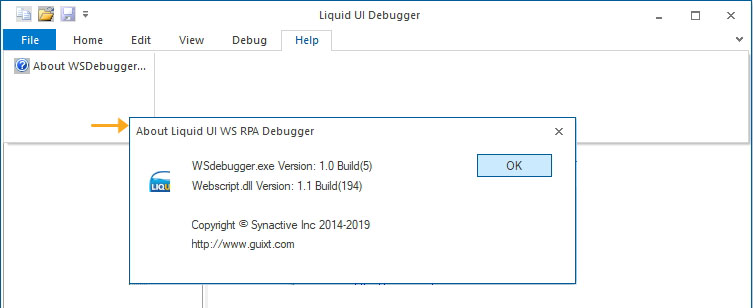
Help: Help menu displays the version number and copyright information in the About dialog box appears as shown below.
Debug menu
Debug menu also includes toolbar items and other debug related options as follows;
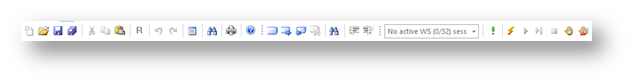
Standard Menu: You can view file editing options

- New: Creates new document in the editor (Ctrl+N)
- Open: Opens the existing script file in the editor (Ctrl+O)
- Save: Saves the opened script file in the editor (Ctrl+S)
- Save all: Saves all the opened documents in the editor (Ctrl+S
- Cut: Removes the selected text from the editor and saves it in the clipboard (Ctrl+X)
- Copy: Saves the selected text from the editor in the clipboard (Ctrl+C)
- Paste: Adds the clipboard content (Ctrl+V)
- Undo: To reverse your previous action on the script (Ctrl+Z)
- Redo: To recover your previous action on the script (Ctrl+Y)
- Output: To show/hide the output window
- Find: To find a specific text in the script (Ctrl+F)
- Print: Prints the Debugger screen (Ctrl+P)
- About: Displays Debugger version and copyright information
Bookmarks: You can view four buttons for bookmarks as shown below:

- Toggle bookmark: inserts and removes bookmark (Ctrl + F2)
- Next bookmark: Go to the next temporary bookmark (F2)
- Previous Bookmark: Go to the previous temporary bookmark (Shift + F2)
- Clear all bookmarks: Clear all bookmarks in the window
Indents: You can use the below icons to change indents.

- Find the specified text from the script (Ctrl + F)
- Increase indent right one tab
- Decr>ease indent left one tab
Session id: You can view “session-id” of the script with respect to SAP GUI. If there is no script to debug, it shows “No active WS session.
Session id: You can view “session-id” of the script with respect to SAP GUI. If there is script to debug, it shows “session id:101".
Refresh: You can use this button to refresh the session.

Start debugging: You can use this button after launching the SAP GUI. It waits for the transaction to attach.

Go (F5): You can start or continue debugging the program.

Step over (F8): You can use step over functionality to debug the code either sequential way or stop at the breakpoint.

Stop debugging: You can stop the program manually.

Breakpoints: You can either insert or remove the single breakpoint and multiple breakpoints at a single instance.