Liquid UI Debugger is designed to perform the following actions:
- Execute the Liquid UI scripts
- Inspect the script code issues
- Edit, and monitor the scripts’ process flow
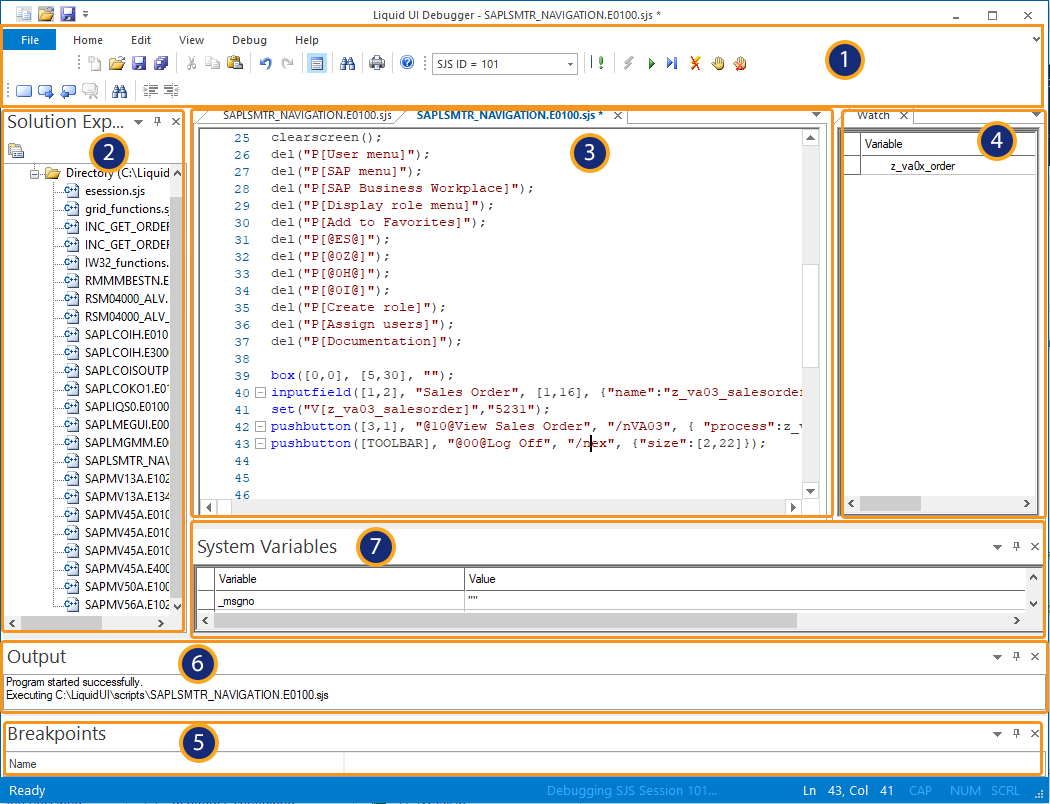
It provides an intuitive interface to set breakpoints, watch variables, system variables values, step through the script, and debug any part of the script to quickly find bugs. The Debugger interface consists of the following sections:
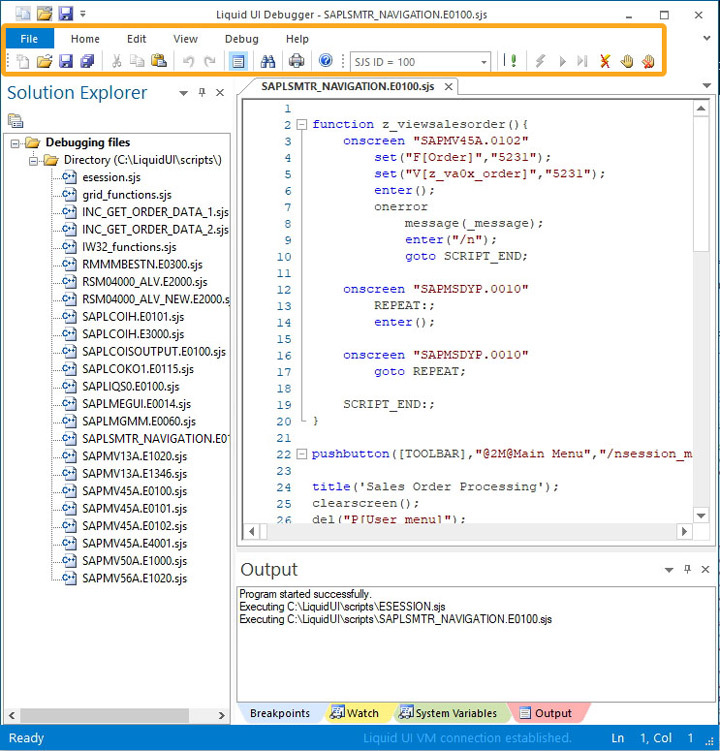
Menu
The Menu bar in the Debugger consists of three types of menus: toolbar menu, main menu and debug menu. These sub-menu options help the users to perform the required actions on the Debugger. Click here for more information related to the menu bar.
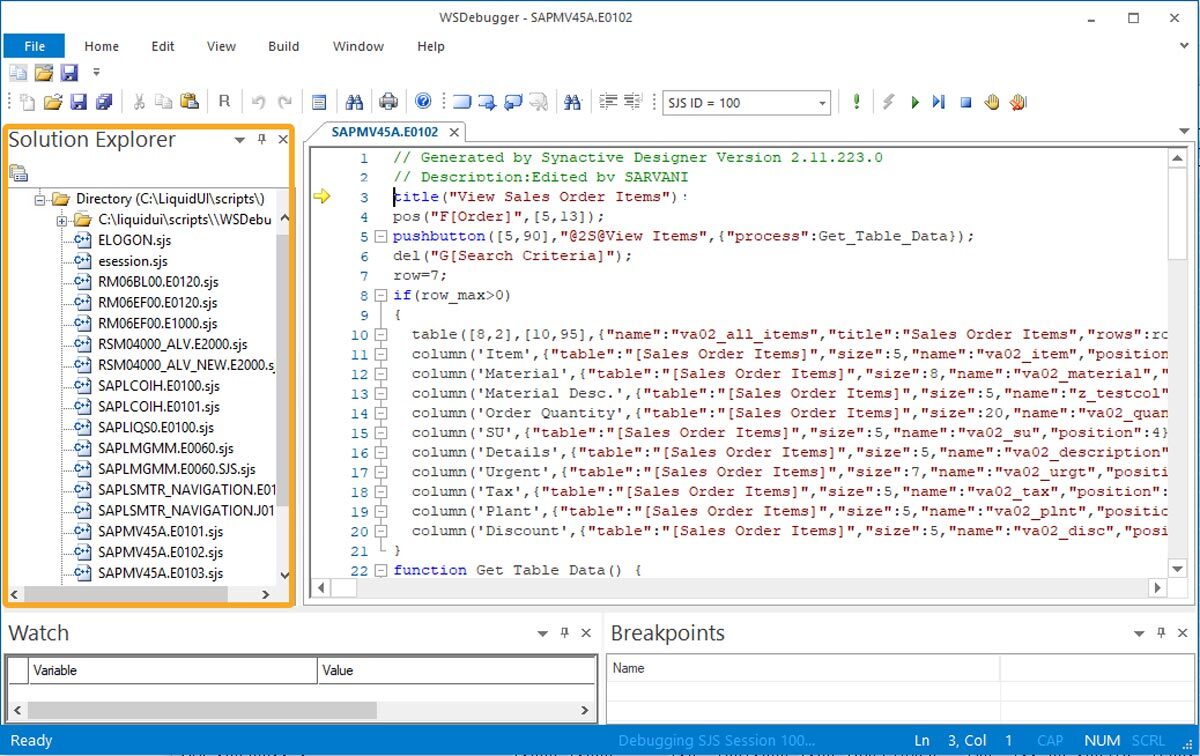
Solutions Explorer
The Solutions Explorer window in the Debugger displays various script files available in the script folder. It provides distinct options to organize, add and/or remove the script files as per the requirements. Click here for more information related to the solutions explorer.
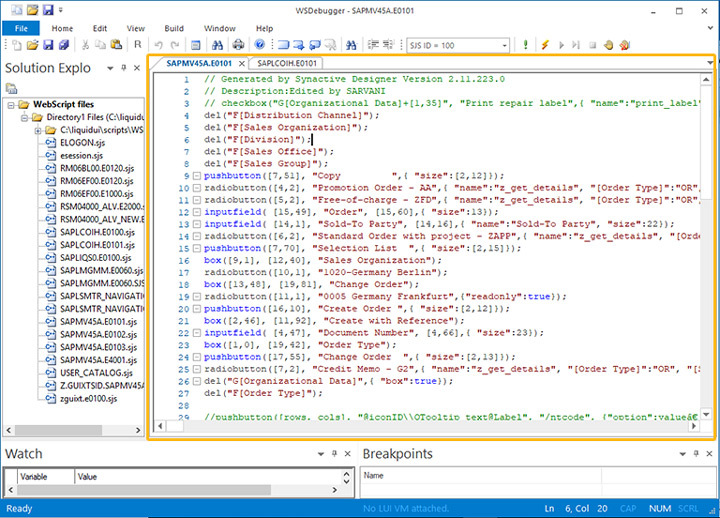
Editor
The Editor window in the Debugger provides the users with options to debug the SAP screen script file. It also provides other functionalities such as the Automatic scroll-down and Go To, to help the user in debugging the script with ease. Click here for more information related to the editor.
Watch Window
You can add the script variables to the Watch Window, to observe the changes in the variable values throughout the script execution.
Add variable
You can add variable(s) to the watch window in two ways:
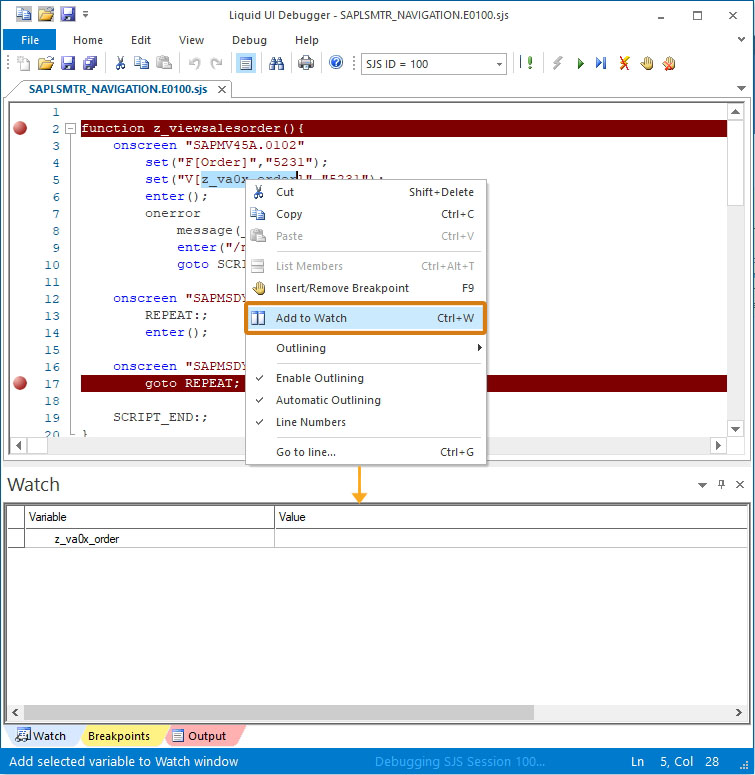
The first way is adding variables automatically. Follow the below process to add variables automatically.
- Select the variable present on the script editor and perform right-click. You will see a popup window.
- Click the “Add to Watch” option. The variable will be added to the watch window.
The second way is adding variables manually and follow the below sequence for this method.
- Right-click on the watch window and click Add Row.
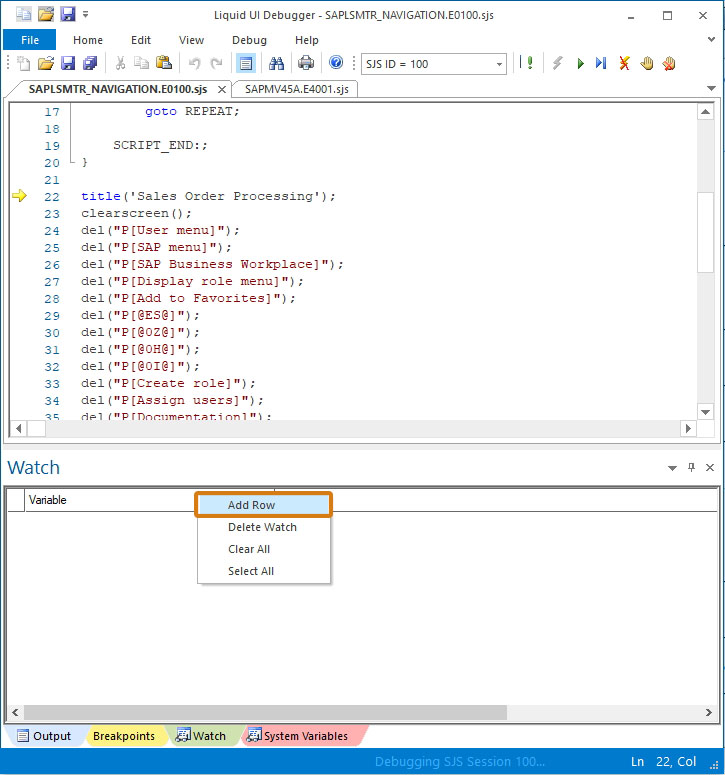
- A new row will be added to the watch window.
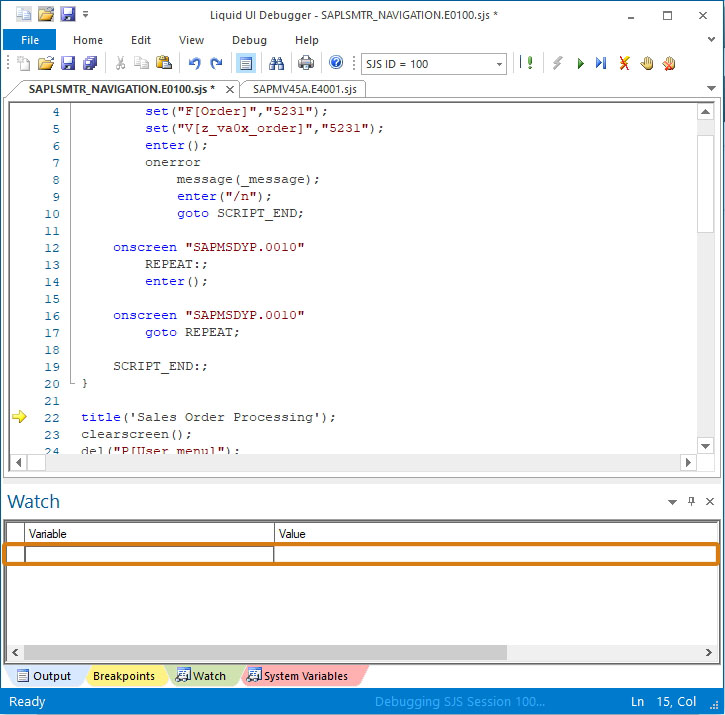
- Double click on the row, this will allow you to edit the row.
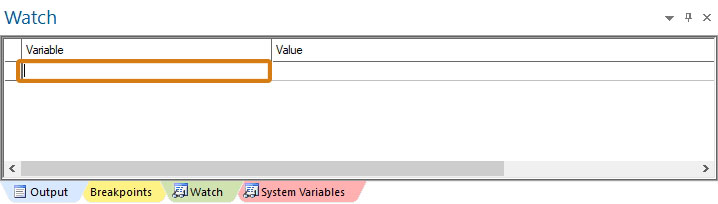
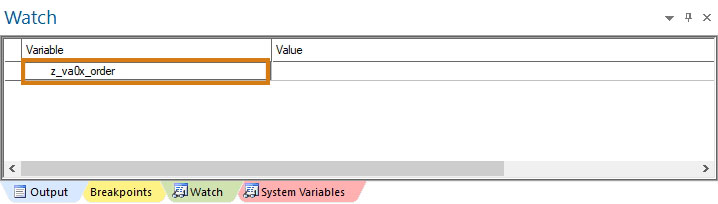
- Enter any variable manually into the row.
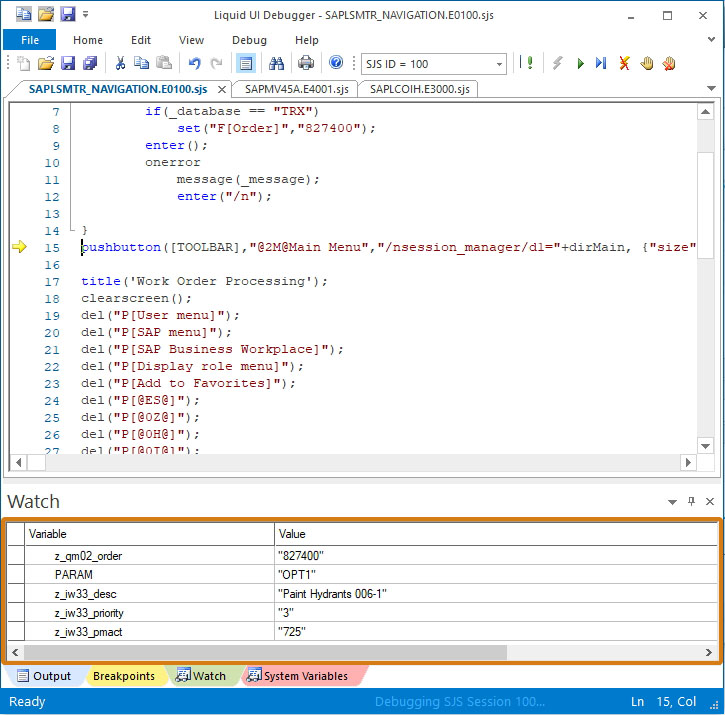
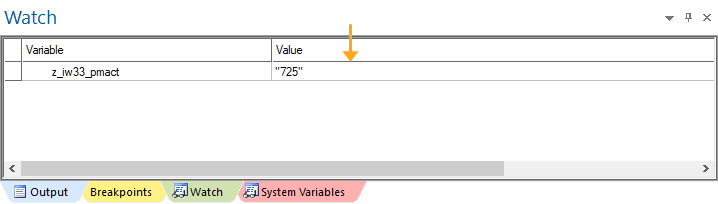
Examine variable values
The Debugger helps you parse the script running in the background. It retrieves the current value of the variable(s) during the script execution and displays it on the watch window.
- When you perform any action like save, execute, or display any particular script on the SAP screen, the variable values will vary based on the action. You can watch these variable values on the Watch Window.
Remove variables
To remove the variable(s) from the watch window, follow the below-mentioned steps:
- Perform right-click on the row and click on the Delete Watch option to delete the variable.
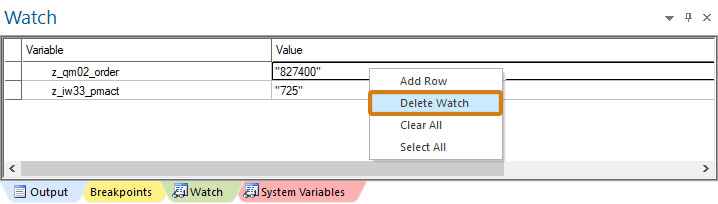
- The row will be deleted from the watch window.
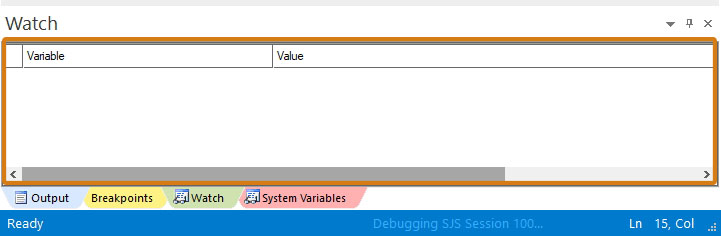
- To remove all the watched variables, right-click on the watch window and click “Clear All”.
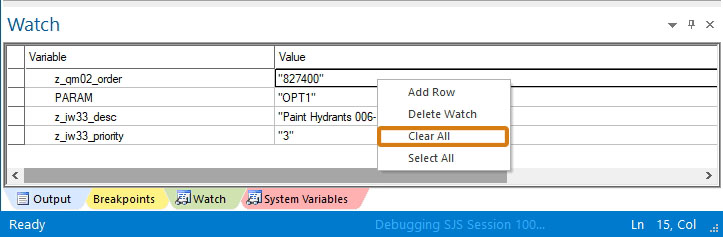
- It will remove all the watched variables from the watch window list.

Note: Make sure to close all the instances from your target system, for the debugger to run more efficiently.
Breakpoints
Breakpoints enable you to insert or remove breakpoints in the script editor as per your requirement. You can use the Insert/Remove Breakpoints (F9) button to toggle the breakpoints on the script line.
- Place the line marker on the required line on the script and click Insert/Remove Breakpoint(F9) button to insert or remove the breakpoints. This will enable the breakpoint by marking the line into a red color.
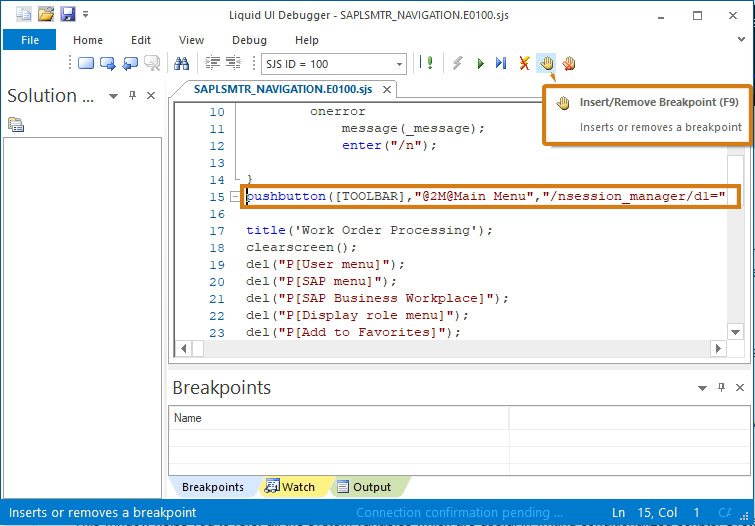
- You can insert multiple breakpoints as per the requirement on the script.
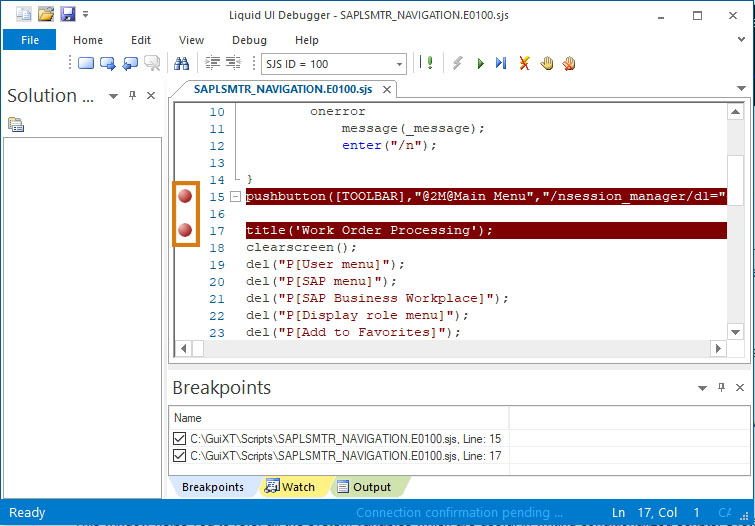
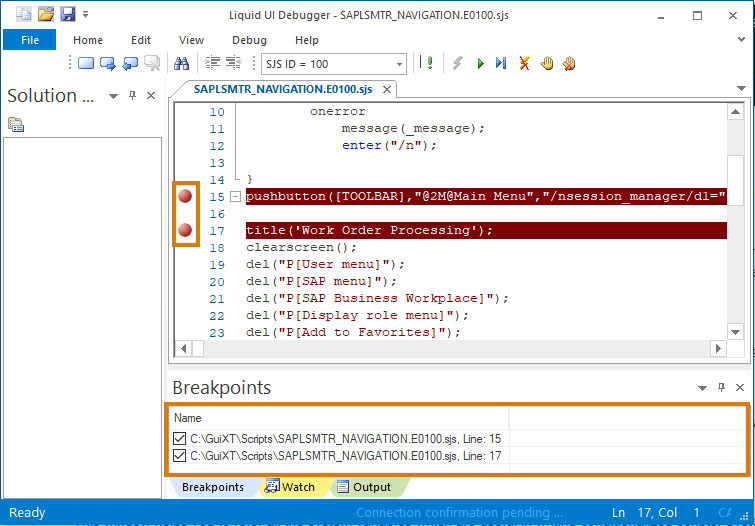
- After applying breakpoints, the line number along with the file name gets updated into the Breakpoints window.
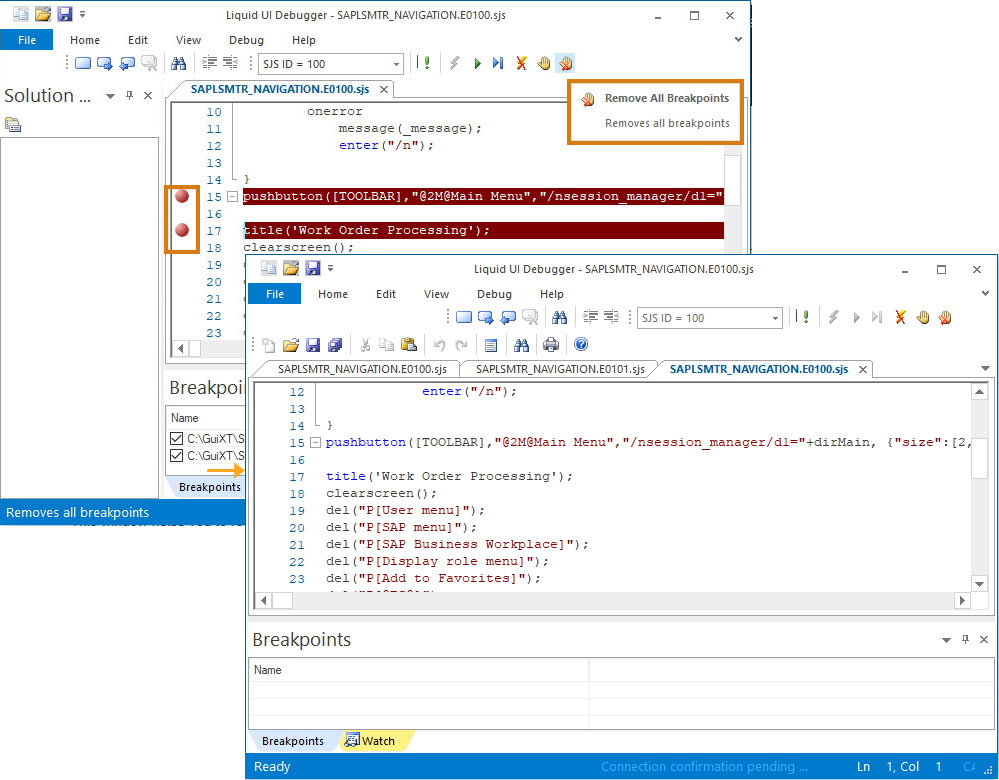
- Click the Remove All Breakpoints button from the build toolbar to remove all the breakpoints at a single instance.
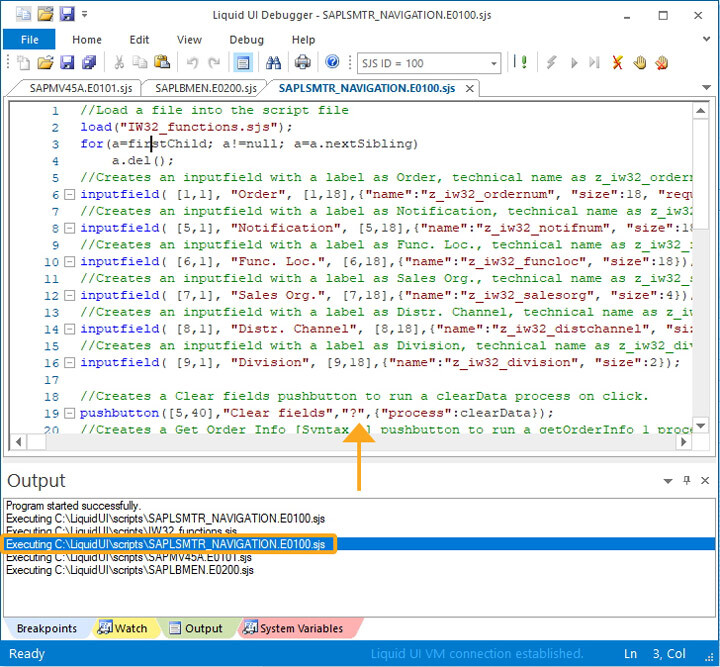
Output
The Output window helps you to know whether the Debugger was successfully attached to the SAP GUI. This window also displays the script files executing on the SAP screen with their file path.
- Login to SAP GUI and launch the Debugger using any one of the following three ways:
- Entering the /ws_h() in the tcode field
- Double-click the WSDebugger.exe file
- Run the .exe file using the command prompt
- The output window is displayed at the bottom of the Debugger screen. In this window, you will see the file path of the SAP screen script files while working on SAP.
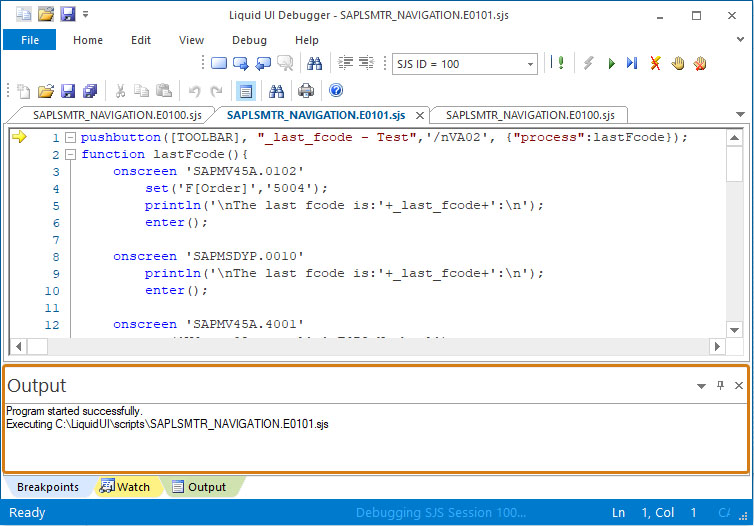
- Double-click on the file path to open one of the script files displayed in the output window.
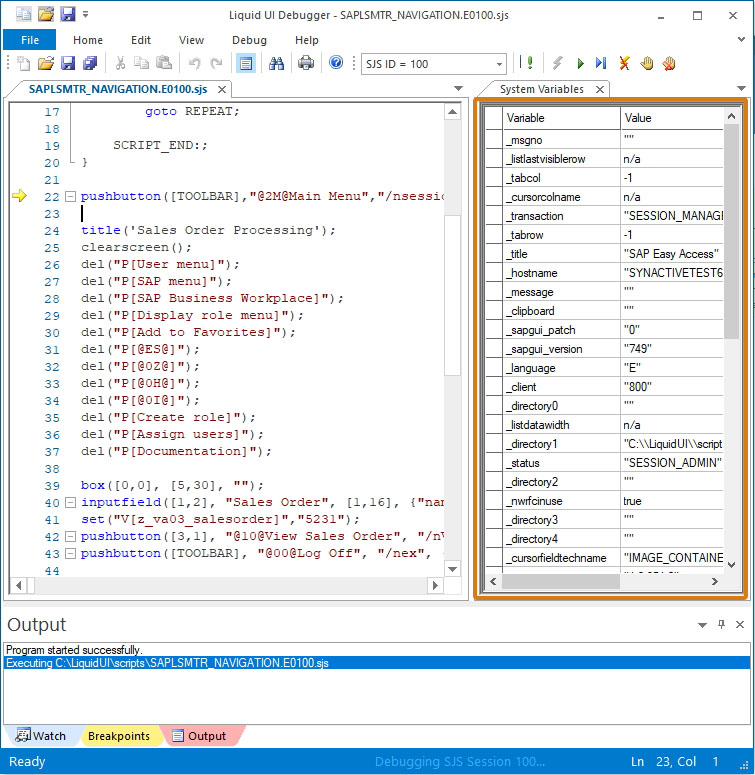
System Variables
This window helps you to refer to all the system variables, which can be useful to write conditionalized scripts. System variables, as the name suggests, are specific to the system and the user account. You can find the script directory path, logged in the user name, version number, etc.
- Login to SAP GUI and launch the Debugger using any one of the three different ways mentioned in the output section above.
- Now, you will be able to see the default system variable values and the values of the system variables used in the script.