The graphical representation of account information in LAMP provides a visual overview, facilitating easy interpretation and analysis of the number of purchased licenses, devices registered, SAP connections, and more.
- Log into LAMP and navigate to your Account Administration page. Here, you will find the graphs of the following account parameters:
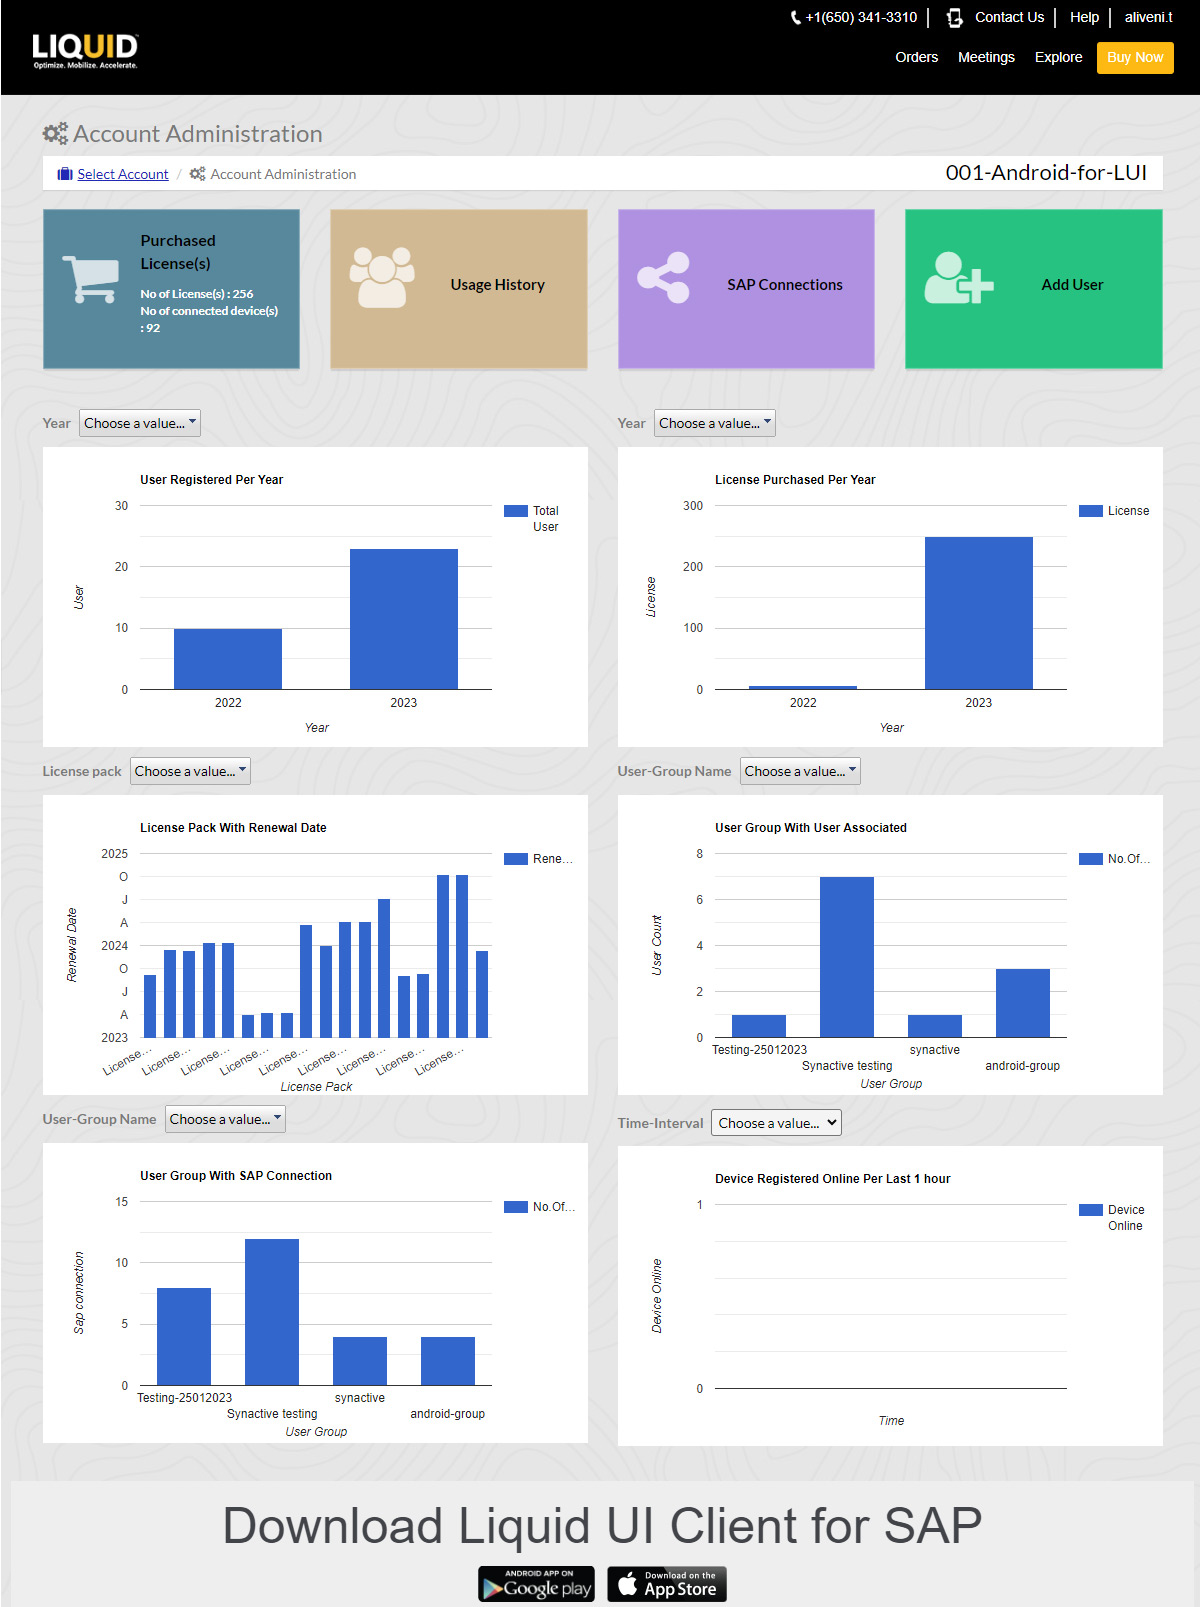
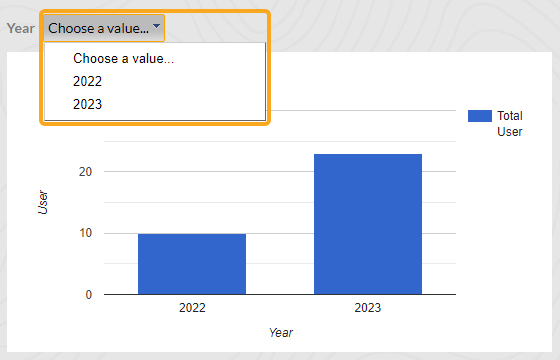
Number of users registered per year
- The first graph displays the number of users registered per annum, as shown below:
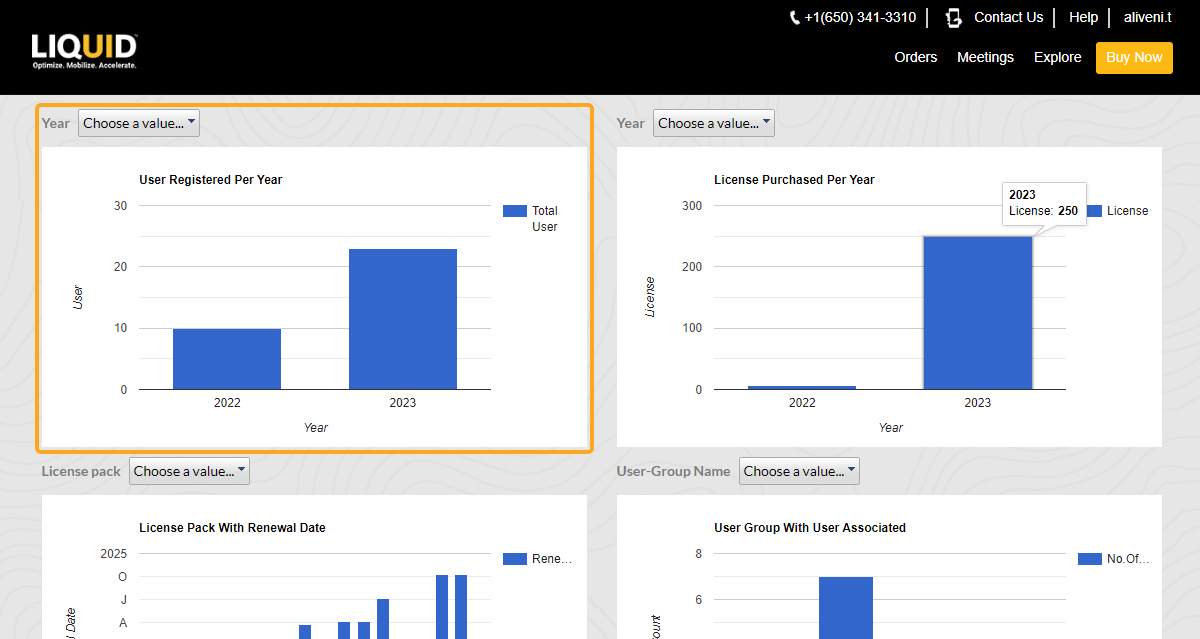
- Here you can select the year from the dropdown list to observe a change in the total number of registered users for the selected year in your account.
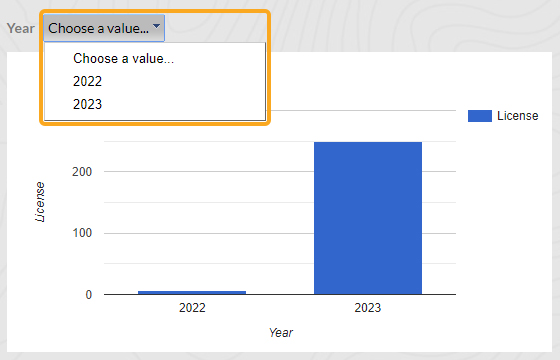
Number of licenses purchased per year
- The second graph displays the number of licenses registered in the selected year, as shown below:
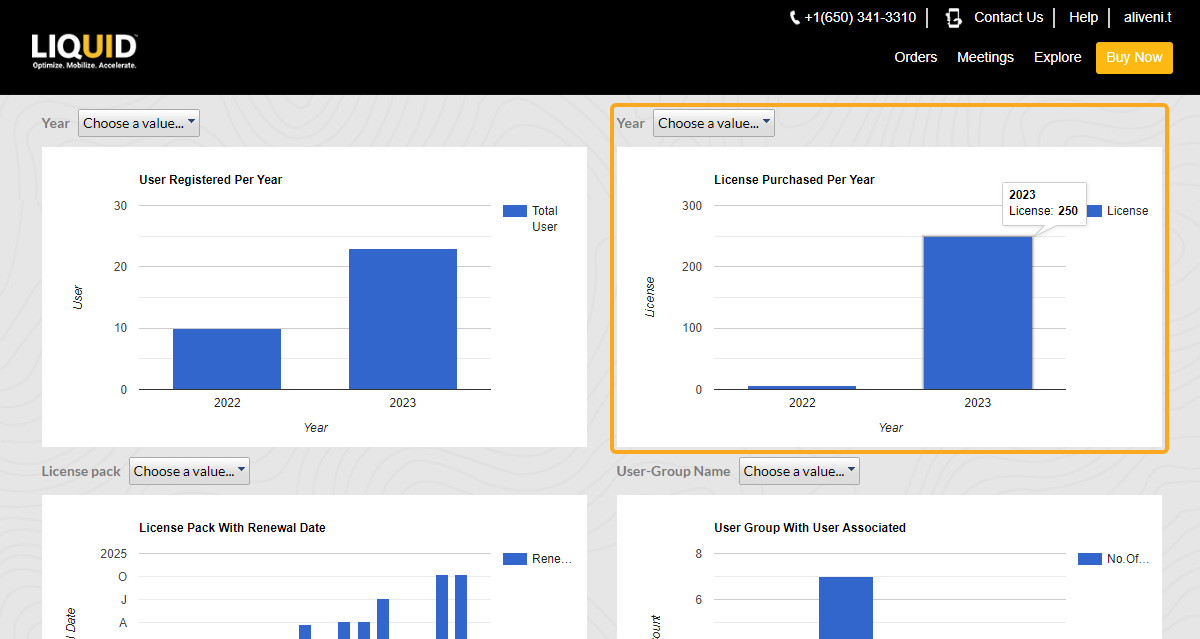
- Utilize the filter option (Year) to view the changes in the number of registered users in the selected year for the account.
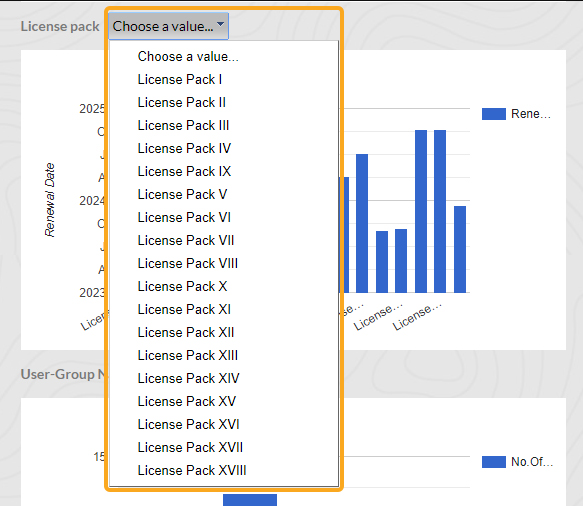
Renewal Date of the license pack
- The third graph displays the renewal date of the available license packs in the account, as shown below:
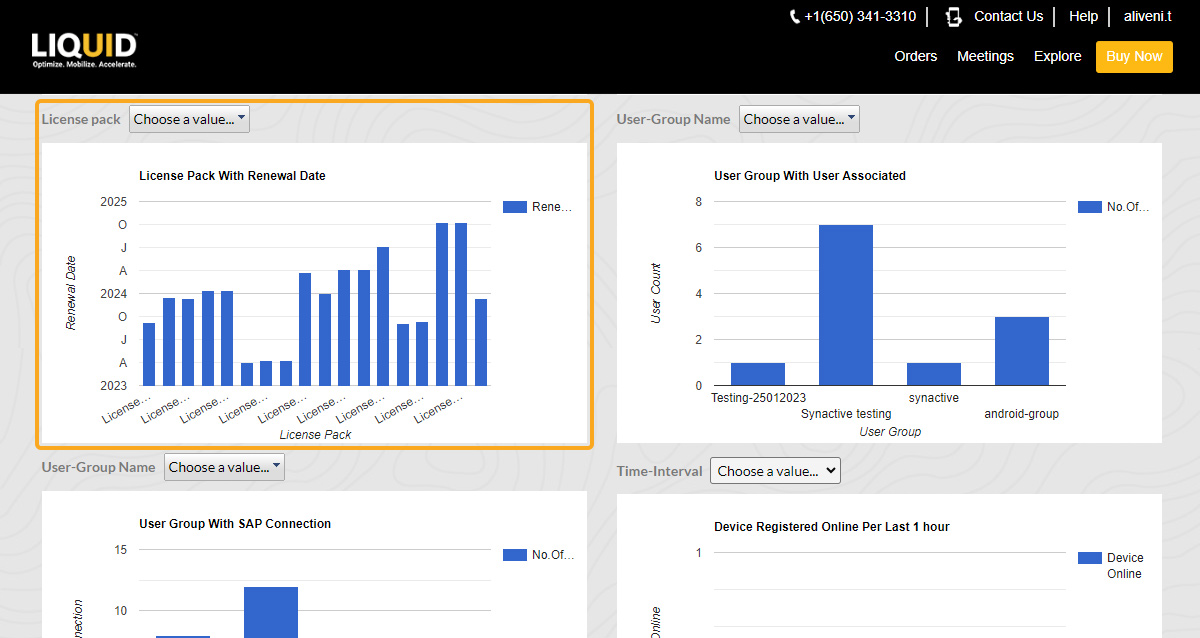
- Here, you can select the license pack from the dropdown list to observe the renewal dates of various license packs available in the account.
Number of users in a user group
- The fourth graph displays the number of users in a user group, as shown below.
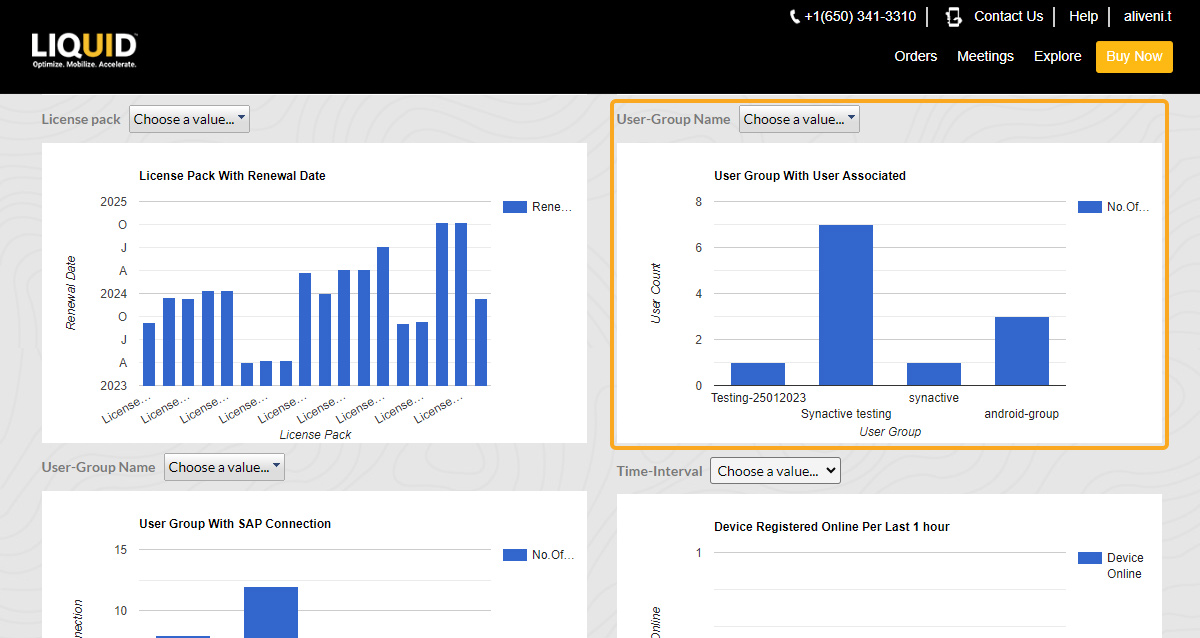
- Utilize the filter option to view the number of users added to a user group in the account.
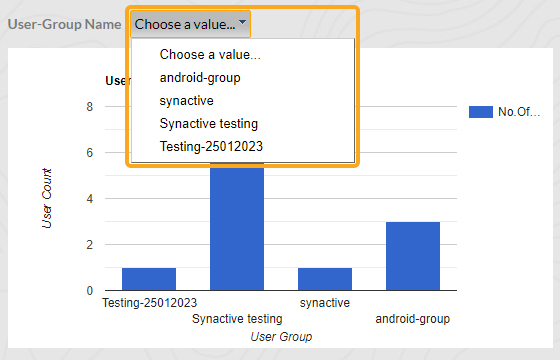

Note: To view user groups in the dropdownlist, create user groups, associate users, and SAP connections within these groups.
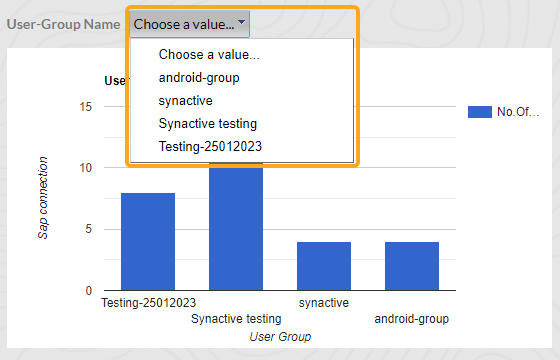
Number of SAP Connections in a user group
- The fifth graph depicts the number of SAP Connections added to a user group.
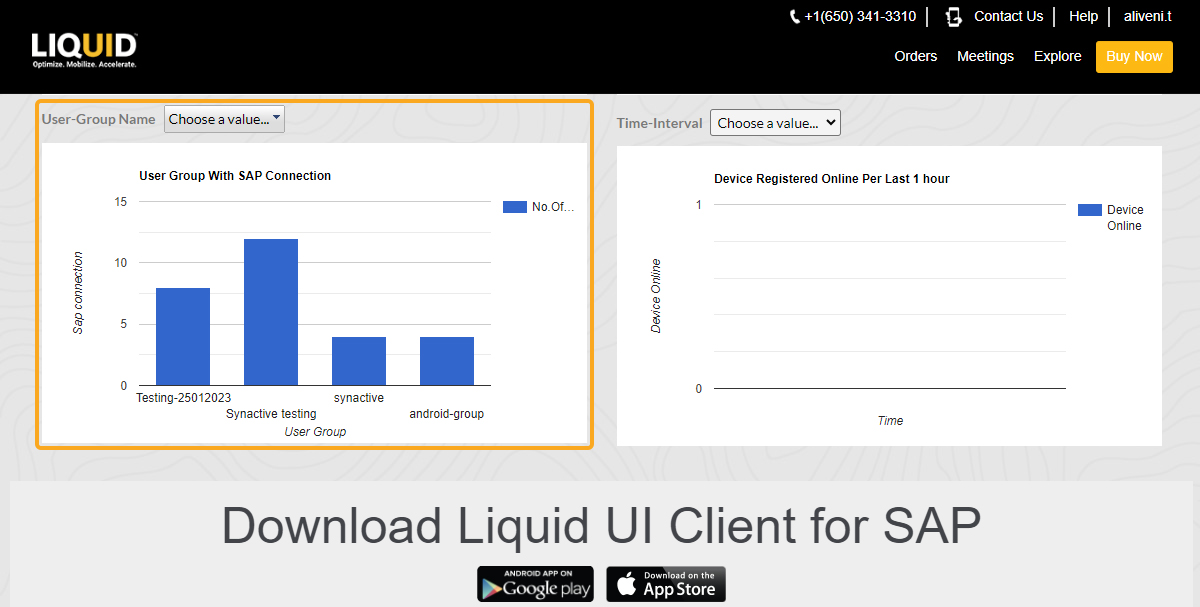
- Utilize the filter option to view the change in the number of SAP Connections added to a user group in the account.
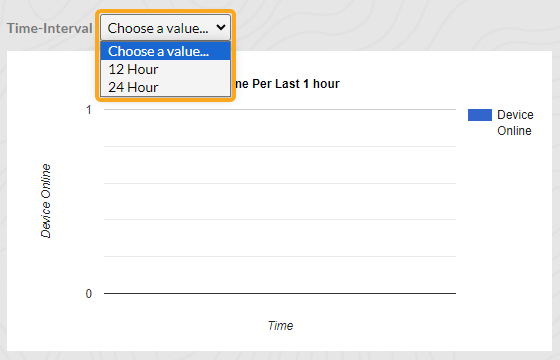
Number of devices registered online per hour
- The sixth graph depicts the number of devices registered in the last hour.
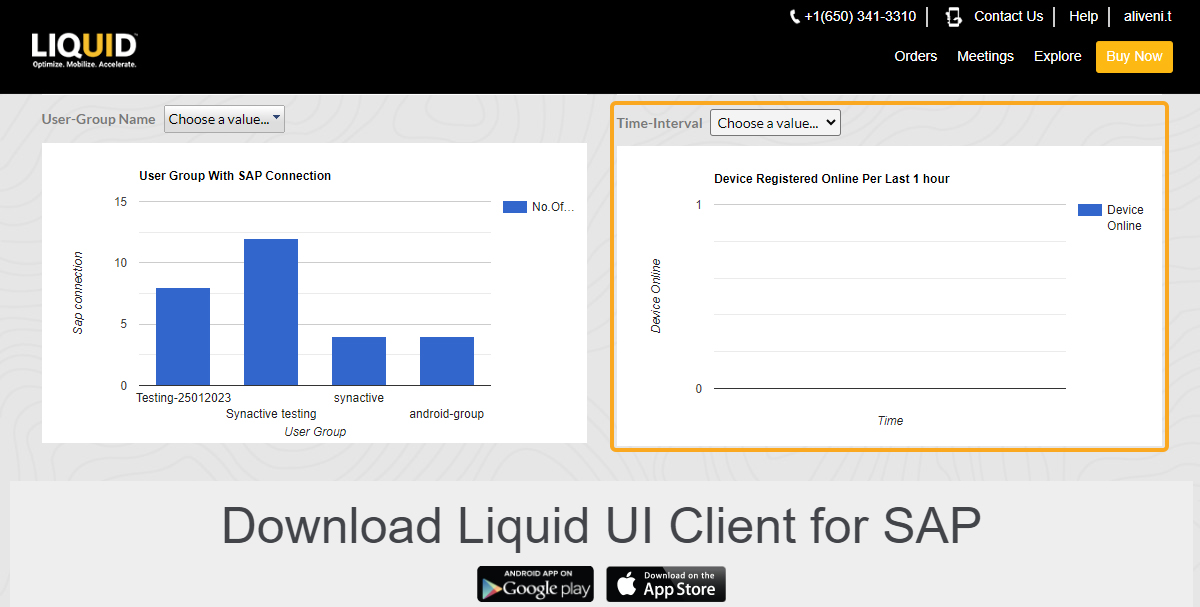
- Here, you can choose between a 12-hour or 24-hour time format to view the number of registered devices.